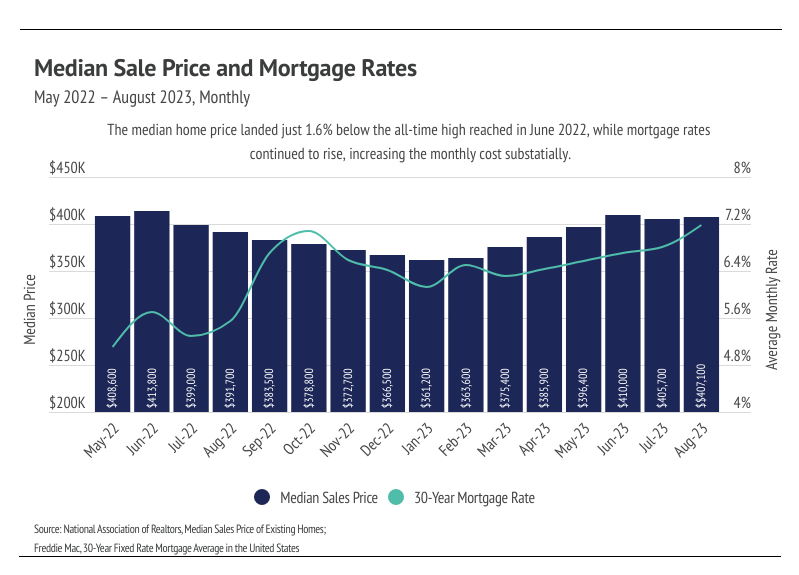
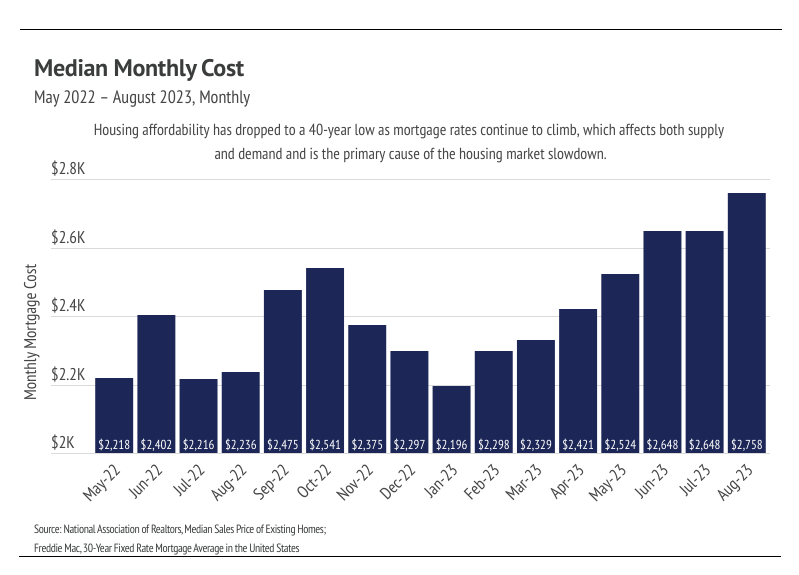
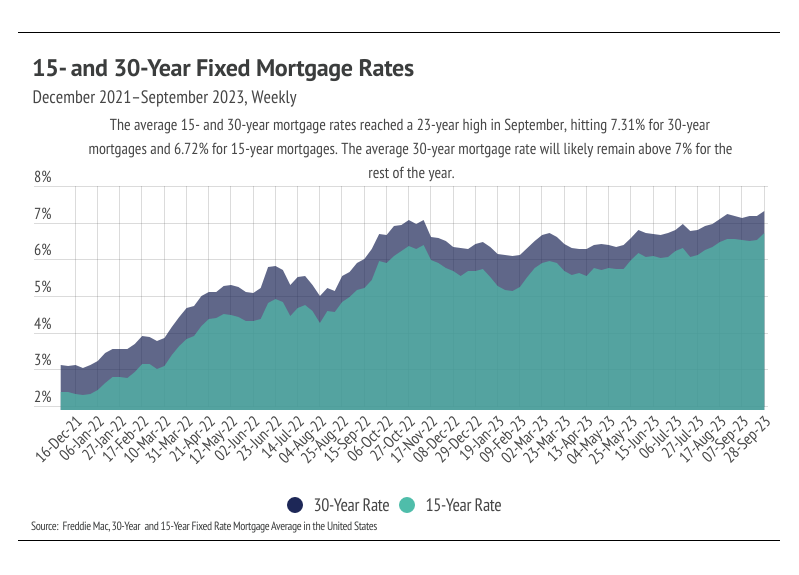
The average 30-year mortgage rate hit a 23-year high in September, closing the month at 7.31%. The current high mortgage rates are negatively affecting affordability, making it incredibly hard not to compare mortgage rates and prices to those of the past few years — because the comparison is so stark. In 2020 and 2021, 30-year mortgage rates were the lowest in history at an average of 3.11% and 2.96%, respectively. Low rates priced buyers into the market, which drastically grew demand in a market with fairly static short-term supply. Competition among buyers rose sharply, increasing prices at the fastest rate ever. The Case-Shiller 20-City Composite Home Price Index rose 41% from June 2020 to June 2022. Meanwhile, inventory plummeted, creating an even larger supply issue than the already undersupplied U.S. market. Although home prices contracted in the second half of 2022, as the Fed began hiking rates, they bounced back in the first half of 2023 and are now only 1.6% below the all-time high. Once we couple the median price with the average 30-year mortgage rate, we can see the actual monthly cost rather than just the price. Only 27% of homes were purchased with cash in August, a good portion of which were likely bought by homeowners selling their home and using the proceeds to buy another. Most buyers, however, are financing the purchase of their homes in some capacity and are, therefore, affected by the high mortgage rates. To put the change into perspective, the median home financed in August 2023 cost 15% more on a monthly basis than the median home financed in June 2022 — the all-time high price — because rates are 1.8% higher.
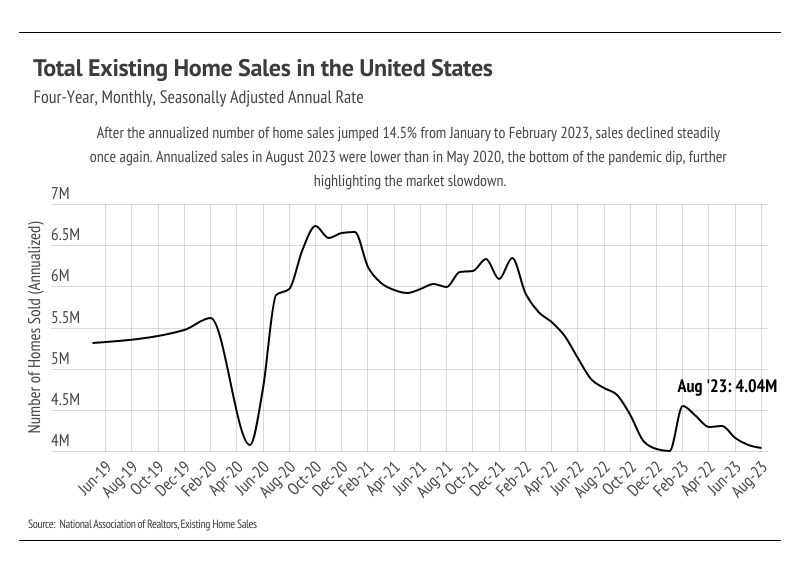
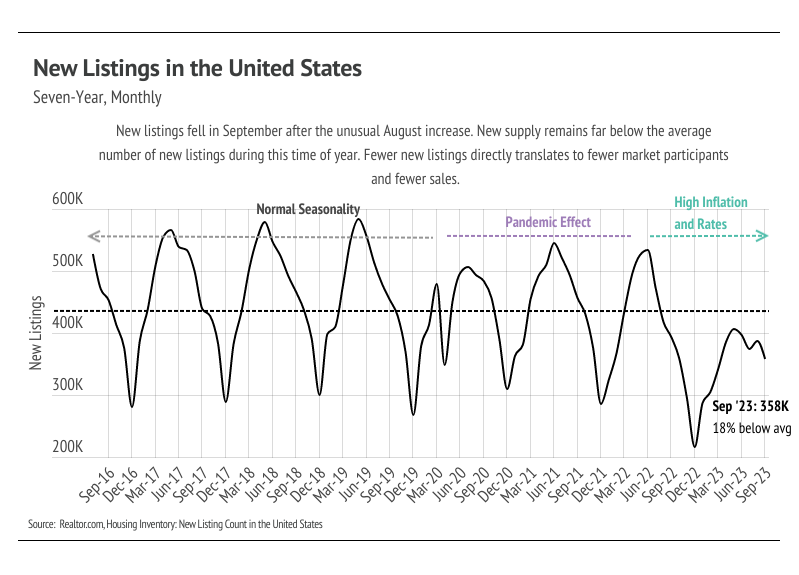
As you’ve likely already noticed, our current market involves an interesting dynamic of low supply and demand, but high prices and cost of financing. A lot of this has to do with (potential) seller mentality. Approximately 75% of U.S. homeowners have mortgage rates of less than 4%, according to JPMorgan, which has kept potential sellers from entering the market because they either stay in their home or keep their home as a rental property when they move. As a result, new listings remain significantly depressed. When we compare the first three quarters of 2022 and 2023 with the average from the first three quarters of 2017 to 2021, new listings are below average by about 1.5 million homes. The National Association of Realtors reported that the number of homes sold dropped 0.74% month over month and 15.3% year over year, which is less surprising considering that there are far fewer homes from which to choose. That being said, people move for all sorts of reasons, and supply has declined further than demand, which has helped prices stay high. Homebuilders are also affected by higher rates when it comes to construction loans, so homebuilder sentiment is in decline, according to the National Association of Home Builders/Wells Fargo Housing Market Index. We will likely see fewer and fewer new homes built until rates come down, negatively affecting supply.
Different regions and individual houses vary from the broad national trends, so we’ve included a Local Lowdown below to provide you with in-depth coverage for your area. In general, higher-priced regions (the West and Northeast) have been hit harder by mortgage rate hikes than less expensive markets (the South and Midwest) because of the absolute dollar cost of the rate hikes and limited ability to build new homes. As always, we will continue to monitor the housing and economic markets to best guide you in buying or selling your home.
Big Story Data
The Local Lowdown
-
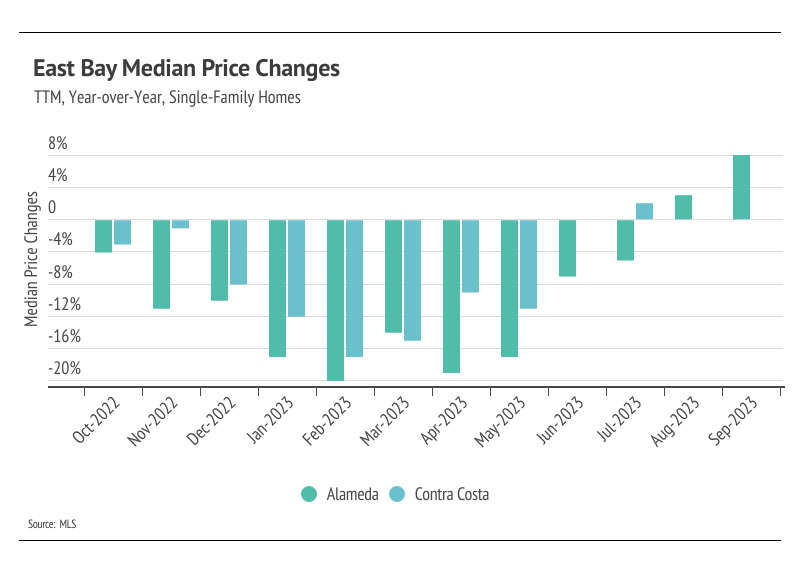
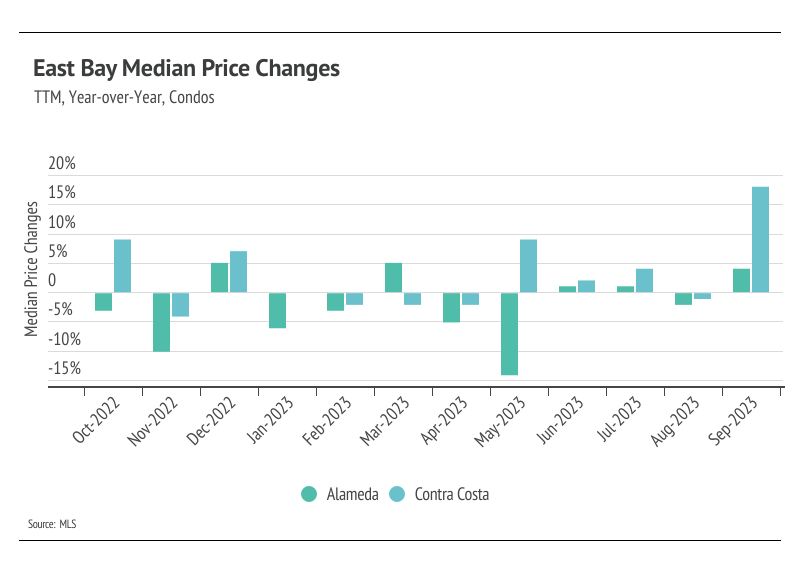
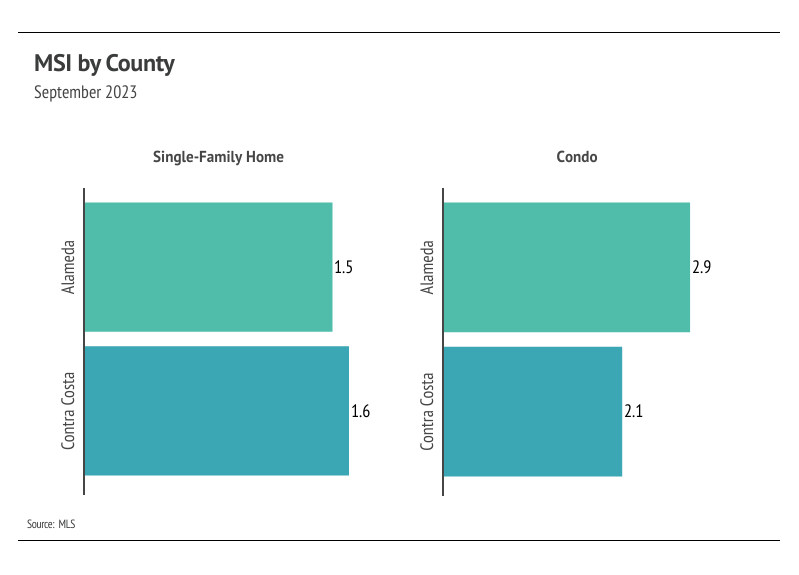
Year over year, single-family home and condo prices were up across the East Bay. Contra Costa condo prices rose most significantly, up 18% since last September. We expect home prices to remain fairly stable in the fourth quarter.
-
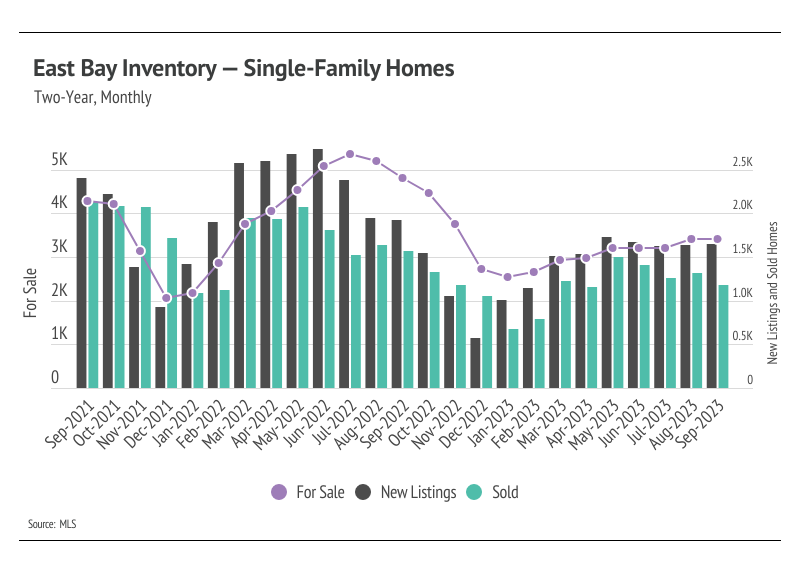
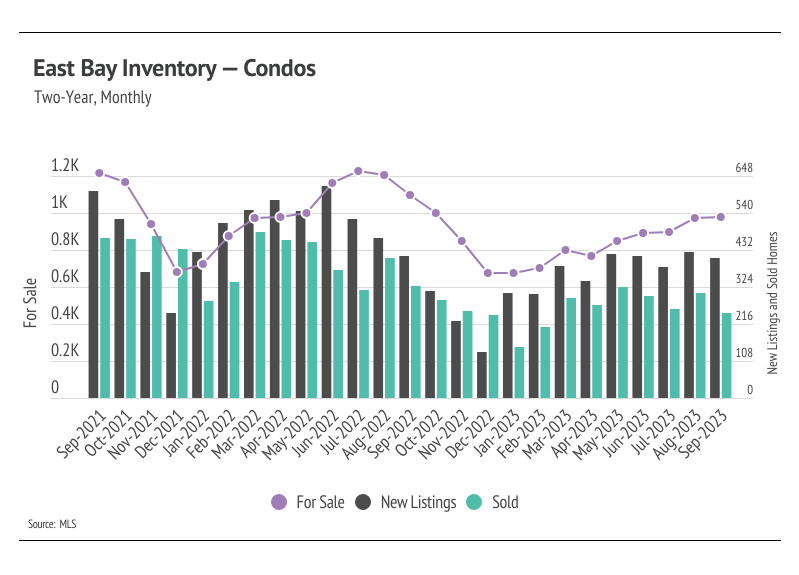
Active listings in the East Bay rose from August to September, continuing the 9-month upward trend. Rising inventory is only good for the undersupplied East Bay market, which is still 26% below last year’s level.
-
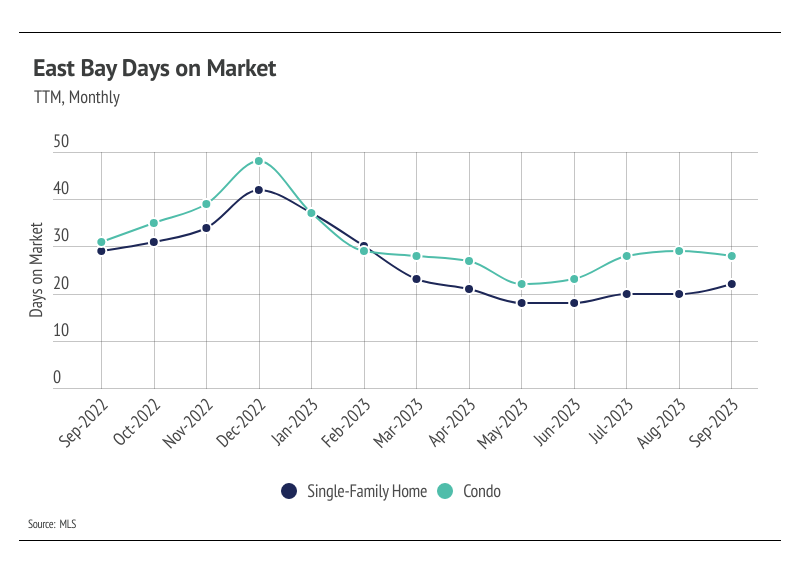
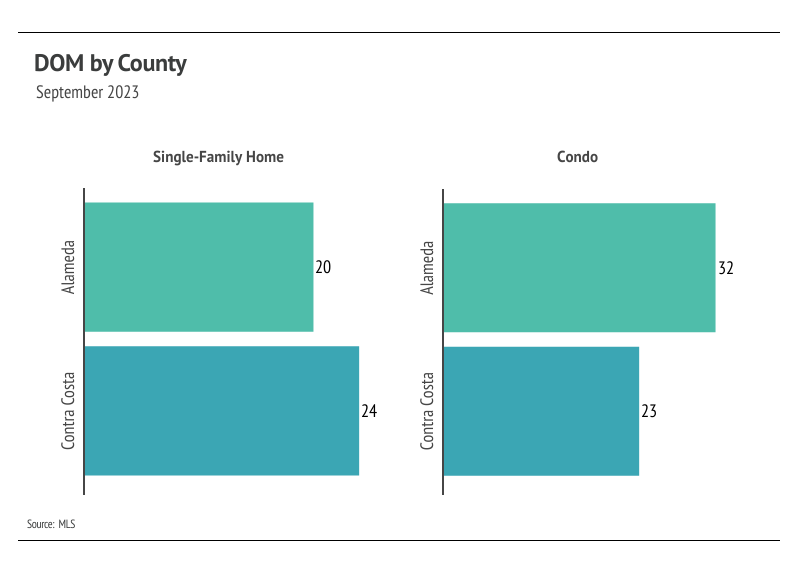
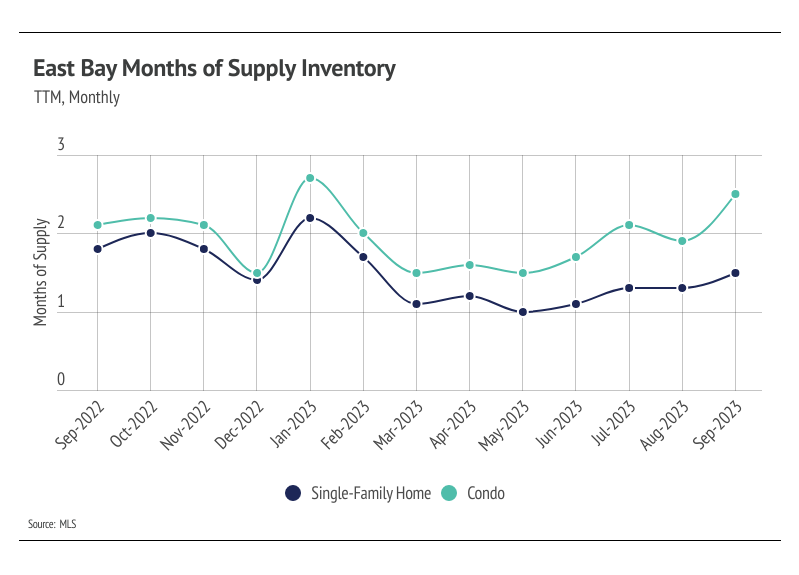
Months of Supply Inventory rose in September as sales slowed and days on market increased. It’s common for the market to trend toward balance in the fall and winter, when fewer buyers are in the market. Currently, the market still favors sellers.
Note: You can find the charts/graphs for the Local Lowdown at the end of this section.
Prices rose month over month across the East Bay
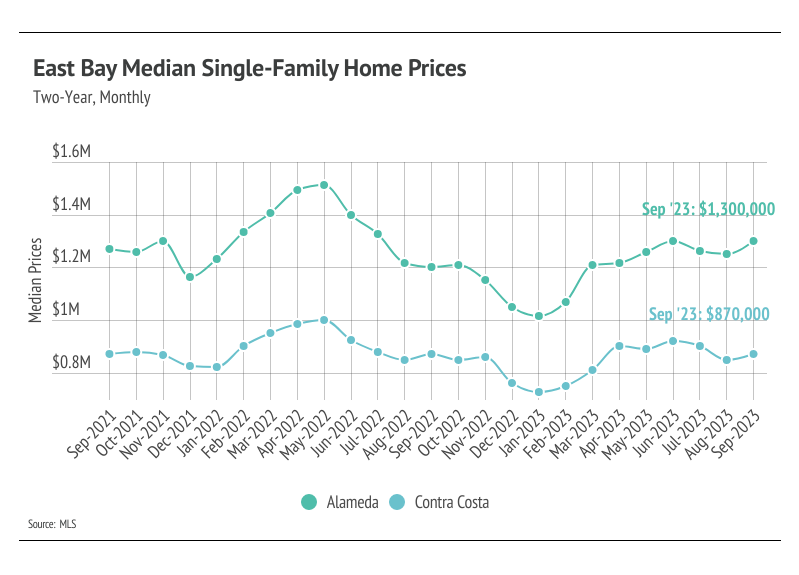
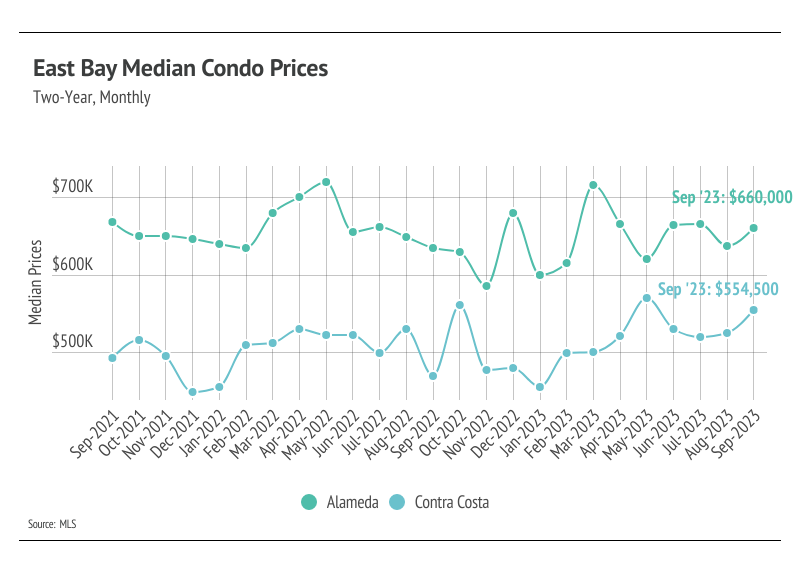
In the East Bay, the price of housing has remained sticky and has even risen during a period of rapidly rising mortgage rates. Increasing demand and low, but rising inventory helped drive the rapid home price appreciation that the East Bay experienced in the first half of the year. Single-family home prices contracted in July and August but rose in September. Year-to-date prices rose significantly across the East Bay counties with the exception of Alameda condo prices, which are down slightly. Notably, single-family home prices rose 24% in Alameda and 15% in Contra Costa this year. In the fourth quarter, we expect prices to remain fairly stable.
Typically, demand begins to decline in the fall and bottoms out in January, so the low supply of homes should be less of an issue. With mortgage rates at a 23-year high, quality listings are going to have the most competition. This isn’t unusual, but potential homebuyers aren’t nearly as willing to pay a premium for a fixer upper as they were in 2020 and 2021.
Inventory rose in September
Single-family home and condo inventory has trended higher into the fall of 2023, which is far from the seasonal norm. Typically, inventory peaks in July or August and declines through December or January. Even though inventory has increased, it’s still historically low, moving higher primarily due to softening demand (fewer sales) caused by higher interest rates and normal seasonality. Overall, new listings have been exceptionally low this year. The number of home sales is, in part, a function of the number of active listings and new listings coming to market. Comparing new listings from January through September 2023 to the same time period in 2022, new listings are down 32%, which has directly impacted both inventory and sales. Sales are down 24% year over year.
Even as demand slows, sellers are maintaining more negotiating power and receiving more than asking price on average. The average seller received 95% of list in January, which grew to 104% by May. From May to September, the average seller received 104% of list in every month. That being said, the percentage of list price received tends to decline in the winter when fewer buyers are in the market.
Months of Supply Inventory indicates the market is trending toward balance but is still a sellers’ market
Months of Supply Inventory (MSI) quantifies the supply/demand relationship by measuring how many months it would take for all current homes listed on the market to sell at the current rate of sales. The long-term average MSI is around three months in California, which indicates a balanced market. An MSI lower than three indicates that there are more buyers than sellers on the market (meaning it’s a sellers’ market), while a higher MSI indicates there are more sellers than buyers (meaning it’s a buyers’ market). The East Bay market tends to favor sellers, which is reflected in its low MSI. MSI fell sharply in the first quarter this year before trending up in the second and third quarters. But just because MSI has been rising doesn’t mean MSI is high. MSI remained below three months of supply, indicating the market still favors sellers.